July 8, 2023·DesktopAnalytics
7 important metrics to track in desktop apps
Take data driven decisions in your product tracking just the most essential metrics for all desktop applications

Desktop analytics are crucial in understanding the usage and effectiveness of your desktop app. Whether you are using frameworks like Electron or native development like Swift, it's essential to know whether your desktop app is being utilized, to what extent, and in what ways. This information allows you to determine if your app is serving as a valuable interface for your users.
Unlike websites, which have plenty of analytics solutions like Google Analytics, Amplitude, Mixpanel, or others to track user behavior, the options for cross-development applications are very limited. Adapting a website analytics solution can take a lot of development hours. Most desktop apps rely on logging events directly into the database and then connecting with another tool for querying and visualization.
Depending on the nature of your product, a desktop version could be indispensable, or it could be a great way to boost stickiness and user satisfaction for those users who prefer a native, distraction-free environment and enhanced capabilities of your product. To get insights into the usage of your desktop app, you should definitely be tracking at least the basic user analytics from the beginning. These metrics serve as a yardstick for judging whether your app is moving in the right direction or you should rethink something about your product.
Let's explore the seven fundamental metrics that you should be monitoring:
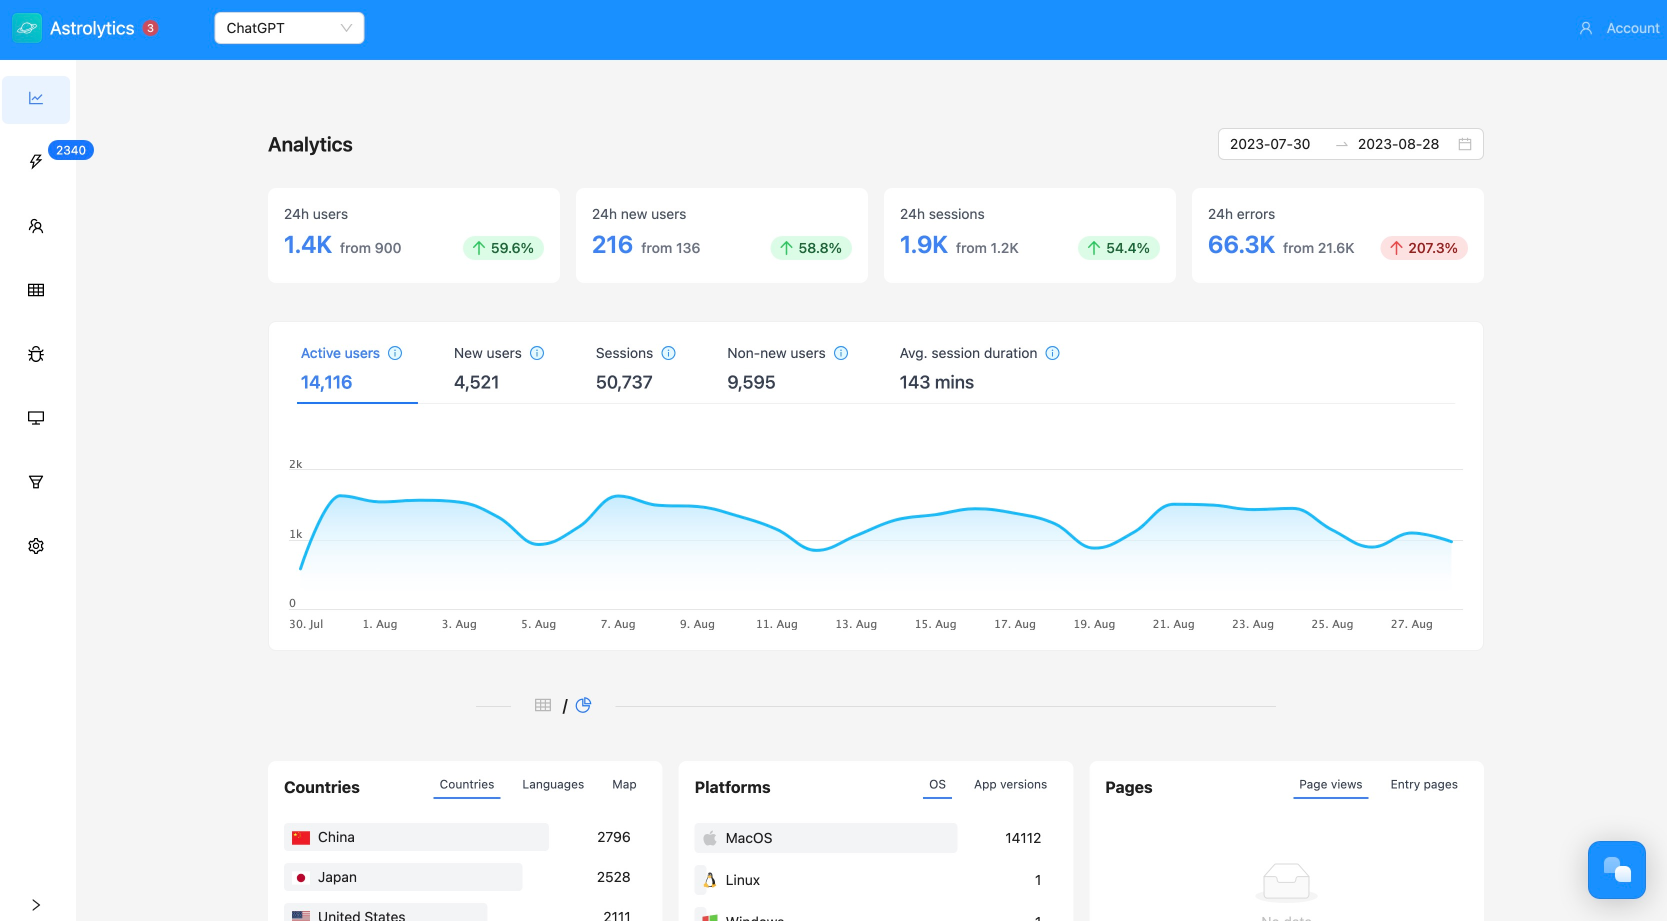
1. Active users over time
While it may seem obvious, many desktop app developers rely solely on download numbers to gauge their app's usage. However, counting active users gives you a more accurate picture of how many individuals have initiated a session within a specific time frame. It's important to note that having a growing number of active users over time is generally a positive sign. However, this alone does not indicate whether your app is being useful to your users. To delve deeper into user engagement, we'll explore additional metrics in the following sections.

2. Daily active users/Weekly active users/Monthly active users
Measuring the ratio of daily active users (DAU) or weekly active users (WAU) to monthly active users (MAU) is a simple but powerful way to understand the stickiness of your product. The DAU/MAU or WAU/MAU ratio indicates how many users are consistently engaging with your app on a daily or weekly basis relative to the monthly user base. The significance of this metric depends on the nature of your product. If your app is designed for daily use, such as a productivity app, you should aim for a high DAU/MAU ratio (above 60%). However, if your DAU/MAU ratio falls below 50% and your app is intended to be used daily, it may indicate potential issues with your app or product.
To calculate this ratio, average the number of daily active users over a month and divide it by the number of monthly active users for that same month.
WhatsApp and Instagram parent Meta, being one of their most important indicators of engagement, boasts the gold standard with almost 80% of their monthly users (people as they call it) using the product daily. If you have something close to that, your product is as sticky as literally the most addictive and sticky product ever created.

3. Sessions
A session represents a user's interaction with your app within a specific period. Monitoring the number of sessions provides insights into how frequently users are logging into your app over a given timeframe, such as a day or week. The number of sessions will often exceed the count of active users, indicating that users are logging in many times per period.
For instance, let’s say that you have an average number of 2.1 sessions per user. Meaning that on average, each active user on the measured period, logged in your app twice. However, averaging things provides limited perspective on how exactly sessions are distributed across users. There might be a subset of users who only log in once, others 5 o 10 times. That information is super valuable to see who your power users are, and see which users are finding more value and returning over and over to your app.


4. Event tracking
Tracking events within your app is crucial for measuring user interactions and conversions. Conversion events are particularly significant as they indicate how many users are successfully achieving the goals set by your app. For example, if you have a to-do app, a key conversion event would be the creation or completion of a task during each session. If users are initiating sessions but not converting, it is essential to investigate further on what needs to happen to encourage the desired actions. Additionally, event tracking can provide insights into the usage of specific or new features that you want to monitor closely or test.

5. App version
Keeping track of the app versions being used by your users is important for ensuring a smooth user experience. If users are using outdated versions of your app without your knowledge, it can lead to issues and a suboptimal experience. Tracking app versions enables you to proactively address bugs, errors, and compatibility problems that may arise with specific versions. By maintaining visibility into the app versions in use, you can ensure that the user-base are updating to the best version of your product.
6. Operating systems
Understanding the operating systems (OS) used by your app's users provides valuable insights into user preferences and behavior. Certain apps may perform better or have specific compatibility requirements on particular operating systems or hardware. Tracking the distribution of operating systems among your user base will help you make better product and development decisions. It allows you to allocate resources effectively and prioritize optimizations based on the predominant operating systems used by your users. For instance, one of our customers recently noted that a particular error just happened in the macOS version of their app, and released and updated accordingly.

7. Geographies
As your app gains traction and reaches a wider audience, you will likely attract users from various geographical locations. Monitoring user activity across different geographies can reveal interesting patterns and insights. For example, you may notice that users from a particular region, such as India, are adopting and sticking with your product at a faster rate. This information can lead to re-focus efforts for that specific geographies which have a stronger need or demand for the product. Being receptive to these insights and understanding the unique needs of different geographies can help shape the overall product strategy. A friend who started his app in the UK, discovered that their app was being used the most in Brazil and today, most of their user-base is from Brazil and pivoted their product to completely focus on the Brazil market (which is huge).

What other metrics could be valuable to track?
While this are just 7 basic things you should be tracking, there are many more that could lead to trajectory-changing product decisions. For instance, one of them are measuring user cohort retention, which provides a super valuable framework to understand how many users of a particular period come back over time.
They are a bit more advanced and will be covered in another post, but we want to let you know that if these metrics make sense for you, our analytics tool Astrolytics helps you track these basic and advanced analytics with our super simple, dev-friendly integration that works with any desktop and web app. In a few minutes, you can all the basic metrics set-up, and you can set tracking of custom events in another few minutes. You can see de docs here.
We are GDPR-friendly, privacy-first, and provide you with a ready to use and beautiful dashboard where you can get actionable product insights. You can see a live demo here.