July 11, 2023·DesktopAnalytics
Top 5 Best Desktop App Analytics Software Tools
The 5 desktop apps popularly used to track products that have a desktop app.

Why Desktop app analytics vs just web?
Why would you bother doing Desktop is the first question corollary to the core of the blog. Many software products need to go beyond the limitations of the “browser” and cater to a multi-environment user-journey. That's where desktop app analytics software tools come into play. These tools offer insights into the performance and user experience specifically of desktop applications.
But why, on the first place, would you choose developing a desktop app over a web-app? We acknowledge web applications have their own merits. But there are several reasons why having a dedicated desktop app is crucial, especially for certain type of products. Products that target professional use-cases, means their users are spending maybe ~50-60% of their waking time there. That will continue to be the case as long as desktop are the dominant platform for work, or until Apple changes that.
For instance, software for creative professionals, productivity apps, or a 3D visualization tool, typically have a dedicated desktop app to offer enhanced performance, a distraction-free environment and a tailored user experience. And for all those, a significant portion of their user-base will on the desktop. Thus, it’s fundamental to understand how well your desktop app is doing.
Creating desktop apps using web technologies like Electron has become increasingly popular, as seen in tools like Notion and Figma. However, seamlessly integrating analytics tools into cross-platform apps can be challenging compared to web-only or web and mobile products. Developers often need to write custom code to capture specific events and data, which is then sent to the analytics provider's API to derive insights.
Despite these challenges, here are five software tools in the market known for their useful analytics that can help desktop apps understand their users. However, some are just better suited specifically for desktop apps and other offer more comprehensive data platforms and functionalities. Let’s explore them in detail.
Top 5 BeAst Desktop App Analytics tools
Astrolytics

Astrolytics is a powerful yet an easy and quick way to set-up desktop app analytics. With Astrolytics, you can get your analytics up and running within minutes, thanks to its lightweight module and privacy-centric approach (no-cookies, making it easier for you to stay GDPR compliant). Whether you have a desktop app or a website, Astrolytics enables you to track cross-platform data effortlessly.
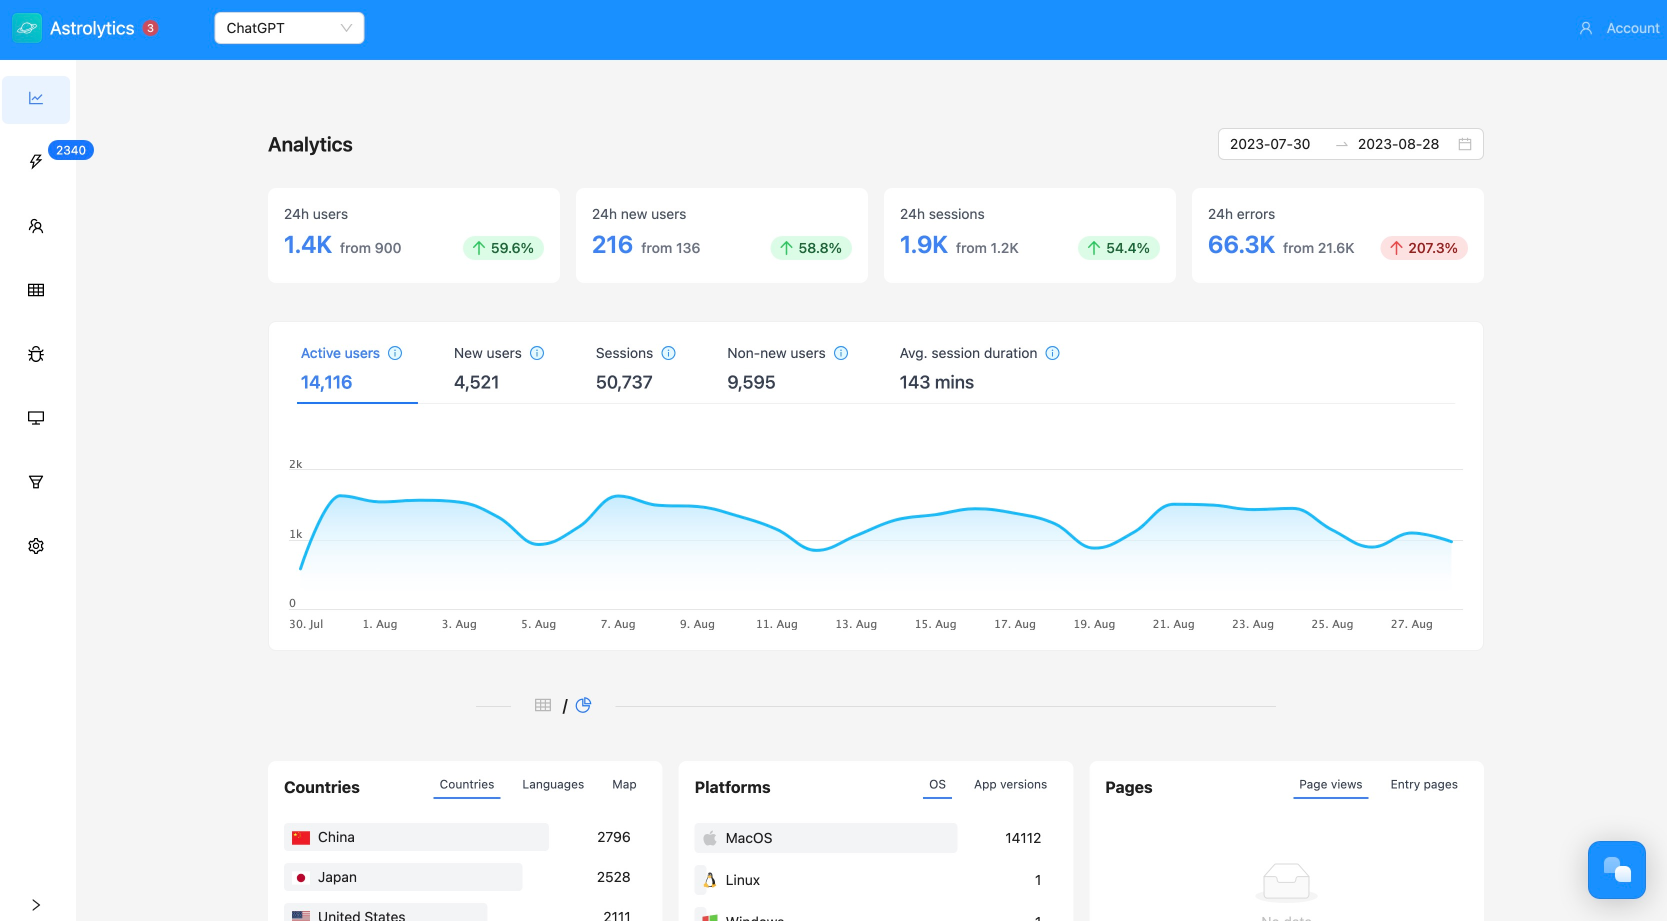
One of the standout features of Astrolytics is its simple and intuitive dashboard. Designed to cater to both product teams and developers, this dashboard will tell you in an instant glance how your app is performing. From understanding user behavior to identifying key actions, Astrolytics helps your team get actionable insights, without the need for complex dashboard setups, an infinite learning curve, or breaking the bank.
Being absolutely fair, Astrolytics is a simple solution. Astrolytics doesn’t have an advanced dashboard building, custom reports, or querying capabilities. But we really think the dashboard includes the most important tracking a product needs to understand how it’s going. My last company scaled to millions of dollars and we just tracked the basic core things to understand how the product is doing with direct logging into the database. If you don’t have product-market-fit, you won’t find it just by tracking every detail of the session recording of your product.
Astrolytics also offers data exporting, white-label dashboard and an API in case you want to build custom dashboards through another platform. You can see more information here.
Matomo

Matomo is a leading open-source web analytics platform that stands as a strong alternative to Google Analytics. With approximately 2.4% of websites worldwide utilizing Matomo, it offers a comprehensive range of analytics features, including A/B testing, goal tracking, heatmaps, and session recordings. One of Matomo's core tenets is its focus on data privacy and ownership, making it an ideal choice for products that prioritize self-hosting and have complete ownership of their data.
While Matomo excels in web-based analytics, integrating it seamlessly for desktop app analytics requires some custom code implementation. This ensures that the ideal metrics needed to track in desktop apps is captured effectively.
Additionally, Matomo's reliance on its open-source community can sometimes result in limitations, poor maintenance, and potential bugs in the community-contributed SDKs and supported technologies. Despite these challenges, Matomo remains a solid substitute for Google Analytics, offering a robust feature set and a privacy-centric approach. So, although suboptimal, it’s not impossible and will require extra developer work to adapt the integration for desktop.
Google Analytics or GA4

When it comes to website analytics, Google Analytics (GA) has long been the gold standard. It's the go-to tool for understanding where your website traffic is coming from and gaining insights into your marketing effectiveness. In fact, GA is integrated into approximately 86% of websites worldwide. This level of adoption is a statement of its simplicity and effectiveness in providing reasonably good website analytics. Some users also like their direct integration with BigQuery and Firebase.
However, there is a downside to relying solely on Google Analytics. GA operates on a cookies-based tracking system, which means that websites using GA must obtain user consent to comply with regulations regarding data privacy. With an increasing number of regulators and privacy-conscious users, some products face the challenge of navigating the evolving landscape of privacy regulations. In countries like Sweden, there are even discussions about banning the use of certain types of website tracking, including GA.
Another aspect that can bring challenges is the complexity of GA4, the latest version of Google Analytics. Many users have criticized GA4 for its intricate setup process, even for basic website analytics. The heavy-weight event-tracking capabilities offered by GA4 may also present a high learning curve for users. If you're looking to adapt Google Analytics for desktop applications, they offer a JavaScript SDK. Unfortunately, for other frameworks and technologies, you’ll have to use the measurement protocol. There’s not too much information and some claim it doesn’t work, so you better use JS if you want to use GA4.
PostHog

PostHog is an open-source product analytics platform that focuses on helping engineers build better products. They are backed by Y Combinator (known for funding analytics giants like Amplitude, Mixpanel, and Heap), PostHog offers a robust suite of analytics solutions like A/B testing, session recording, customer data platform, and others. They also have a cool and funny brand. One of the notable aspects of PostHog is its generous free tier and self-hosted option, which includes features like session recording and bundles multiple analytics solutions into a single connection.
Unlike Matomo and GA, PostHog specializes in product analytics and they have had great success offering the complete product suite through a single connection. However, setting up PostHog can be time-consuming and resource-intensive compared to other analytics platforms. The learning curve to effectively query and analyze data within their feature-rich dashboard is pretty high. Still it is likely simpler than GA4, know for its complexity. But expect a bazooka of possibilities with PostHog.
Similar to other analytics tools discussed, PostHog was not specifically designed for desktop applications. Integrating PostHog with a desktop app requires custom code implementation to capture relevant events and send them to your PostHog instance.
Amplitude

Amplitude, a prominent name in the world of product analytics, offers a comprehensive suite of tools to enhance your product's performance. Similar to PostHog, Amplitude excels in product analytics but does not provide support for website and traffic analytics. Amplitude goes beyond just analytics and also offers a customer data platform, serving as a compelling alternative to Segment.
While Amplitude does offer a free-tier option, it's important to note that exceeding it, could require requesting a demo and engaging with their sales team just to know their price. That makes evident that their primary focus is on large enterprises, leaving new products just starting to take-off a bit uncared.
Once again, Amplitude's platform primarily focuses on web-based and certain mobile platforms. While they mention the ability to support cross-platform analytics, that basically means just web and mobile. This can be limiting for products where the desktop experience is vital, as the majority of their users tend to spend the most time on desktop platforms.
Special mention: Metabase
Metabase is a great open-source business intelligence and data visualization tool. It provides a user-friendly interface that allows users to explore, query and analyze data from various sources, transforming raw data into meaningful insights. With its intuitive dashboard and a SQL and no-code query builder, Metabase enables users to create interactive visualizations and share reports.
While it doesn’t work exactly as an analytics tool, techie teams that have in-detail database logging use it to build analytics dashboards, which serves the same purpose of analytics tools, although a bit limited on the data scope and deepness a native analytic provider can bring. However, this works in simple products that just want to track things like sign-ups, purchases or big goals like that.
Conclusion
In conclusion, while website and web-based analytics solutions can be adapted for desktop apps with some additional development effort and patience to navigate the learning curve, there is a strong recommendation to consider an analytics tool specifically designed for desktop apps, especially if your app is at the core of your product.
For industries like productivity, creativity, and 3D/VR/AR, desktop app plays a crucial role. Using an analytics tool natively built for desktop apps is highly advised. Such a dedicated solution ensures seamless tracking of the data you need to gain insights unique for desktop dynamics and environment.
At Astrolytics, we offer a hassle-free solution for measuring the performance of both web and desktop apps, even when the user uses it offline. With a simple integration process and an intuitive dashboard, Astrolytics enables you to track key metrics such as active users, sessions, user actions, and app versions. Our intuitive, super simple dashboard and easy to integrate module has been used by almost 400 apps and tracked over 20 million events.